
Forest Industries II: North American Wood Products
A leveraged play on the US construction cycle undergoing its worst downcycle since the GFC
Continuing the analysis of Forest Industries from my last article (Forest Industries I: Basics), this article dives a little deeper into the wood products industry in North America.
North America (mainly the US) is one of the largest consumers and producers of wood products (lumber, plywood, OSB, engineered wood). An abundance of forests in the US South, and the Pacific West determines the competitive locations of these industries.
The industry is highly cyclical, both because of its own supply determinants, but also because a majority of its demand comes from construction activity (mainly single-family wood-frame housing), itself a highly cyclical industry.
Today, the industry is undergoing its worst, deepest, and longest downcycle. In many measures (length, capacity underutilization, margins) it is worse than the GFC. Half the companies in the industry are close to or below breakeven EBITDA. These same companies were making money hand over fist in 2021 and 2022.
However, some companies are not so pressured, either because they participate in higher-value subindustries or because they are more diversified into several segments. These companies are well prepared to survive the downcycle, and may emerge as the winners of a recovery, coming either from a reduction in supply or a recovery in housing activity in the US.
This article reviews the characteristics of the wood products in general, in North America in particular, to then analyze each of the public companies participating.
Disclaimer: The opinions expressed in the Blog are for general informational purposes only and are not intended to provide specific advice or recommendations for any individual or on any specific security or investment product.
Index
The Industry
Reviews of the basics
Forest basins in North America
Canadian tariffs
The market in the US
The wood industry and construction after the GFC
New construction
Repair and remodelling
Other uses
Aggregate demand
Annex: changes in construction trends
Capacity, utilization, and margins
Historical capacity
Historical margins
[PAYWALL]
Companies
Weyerhaeuser (WY)
Rayonier + PotlatchDeltic (RYN)
Louisiana-Pacific Corp (LPX)
West Fraser Timber (WFG)
Boise Cascade (BCC)
Canfor (CFP.TO)
Interfor (IFP.TO)
Western Forest Products (WEF.TO)
GreenFirst Forest Products (GFP.TO)
Annex
Forest Industries II: North American Wood Products Annex

Disclaimer: The opinions expressed in the Blog are for general informational purposes only and are not intended to provide specific advice or recommendations for any individual or on any specific security or investment product.
The Premier Annex to the North American Wood Products article provides access to the Excel files for modelling the largest companies analyzed and summarizing their capital allocation and performance history, along with summary reviews of all companies in concise Excel and PDF formats.
The Annex also explores changes in US housing construction trends to establish whether these could represent a risk for demand for the North American wood industry.
Data package
Construction trends in the US
Other articles on the Forest Industries


The industry
Review of the basics

Let’s start by reviewing some aspects of the wood products industry, key to understanding its economics and cycle. Then we can add more data on North America specifically. This is only a short summary. I highly recommend you read the complete section in the Forest Industries Basics article.
Wood products are the largest consumer of wood globally. The industry also consumes the highest quality wood, and it is key for the generation of co-products used in other industries (like pulp).
Wood product demand is highly tied to construction, particularly in North America and Europe. In other areas (particularly China as an exporter), wood product demand is tied to decorative, furniture, and cabinetry functions. Specifically for the North American case, about two-thirds of wood product demand comes directly from residential (especially single-family) construction, both new construction and repair and remodelling (R&R).
One way to distinguish wood products is between structural and panel functions. Structural products need to bear a load in construction or furniture. In contrast, panel products do not generally need significant strength; their function is filling, insulation, or decoration.
Another classification is between lumber products (solid pieces of wood), veneer products (laminates either alone or reglued for higher strength), composites (particles, strands, or fibers reglued together, like OSB, MDF), and engineered wood products (pieces of wood glued for higher strength, like LVL, glulam, mass timber).
In general, lumber and engineered wood products cover more structural functions, whereas veneer and composites are used in panel functions. In addition, lumber products depend more on log quality (and therefore wood is a higher cost component), whereas veneer/composites have a higher manufacturing cost component.Wood products are regionally and even globally traded much more than both raw logs and paper. The competitive regions are based on forest resources, particularly for lumber/solid wood products. In engineered and composite products, industrial capacity is more relevant, but access to raw material sources is still important.
The scale of manufacturing facilities plays a larger role in composite products where non-wood costs are more relevant. In solid wood products, scale has to be traded off with logistic costs from log obtaining and transportation.
Forest basins in North America

North America, as a subcontinent, has three main heavily forested (and economically harvested) regions where most wood comes from:
the Northern Pacific Coast, covering Oregon, Washington, plus northern California in the US, and the Canadian provinces of British Columbia and partially Alberta.
The US Southeast, going from Eastern Texas to the Carolinas and Virginia.
The Northeast, which on the US side includes the Northeast Coast, the lakes region, and in Canada includes Ontario and Quebec.
 and Canada (right side)")
Historically, the Northwest of the continent provided a large part of the production, but since at least the GFC, the totality of the increment in continental production has been provided by the US Southeast.
Today, the US Southeast is the most competitive region in terms of fiber for the majority of forest industries. As explained in the Forest Basics article, temperate regions (like the US South) have, ceteris paribus, higher biological forest productivity (trees grow much faster). Further, although the US South uses natural forest systems, it is increasingly a plantation system region, with the associated productivity benefits described in the Basics article. In contrast, the Western and Northern regions are entirely natural forest systems. Finally, the US South region is much closer (actually within) the areas where the US population has been growing the most, like Texas, Florida, and the Carolinas, and therefore where the most wood is needed for construction.
To the above, we have to add natural factors, like the increasingly recurrent droughts and fires in the US Pacific, and beetle infestations in British Columbia, which have reduced the availability (or increased the cost of harvest) of logs. The effect of tariffs (established in 2018 and discussed below) is also evident in the fall of Canadian production, especially in British Columbia.
In more commoditized, lower log-quality applications, which include most dimensional lumber, plywood, and composites, the US South is displacing the Western regions. The West is increasingly only competitive in export markets in Eastern Asia (mainly Japan and China) for very high-value logs from local species (Douglas fir, western hemlock), which are sold as timbers, decorative veneer logs, high quality dimensional lumber, etc.
Canadian tariffs
Canadian production is also affected by heavy tariffs in the US, and has been so for almost 10 years. The US has consistently argued that the harvest (stumpage) system in Canada, which is based mostly on public (Crown) owned land, is an unfair subsidy to lumber and timber production in Canada versus the mostly private land system in the US.
Since 2018, the US has applied anti-dumping (against selling below a minimum price) and countervailing (against subsidies) duties to Canadian exporters, which are determined by mill/basin, and reviewed every few years. On top of that, the Trade War 2.0 tariffs added 10% flat rates on lumber and timber in 2025. The combined rates depend on each producer, but range from about 25% to as much as 45%.
The duties are paid based on the then-current rate but are applied retroactively to previous production after the next duties review. Therefore, many Canadian companies record an asset (most of the time) or a liability based on what they believe they are entitled to receive or required to pay, compared to their cash-based duties.
An important note is that most engineered products (plywood, OSB, LVL, etc.) are not covered by the duties, but are covered by the additional 10% rates of the Trade War 2.0 tariffs. Even when not covered, these products remain at a disadvantage versus the US because of their dependence on the Canadian forest basin.
The market in the US
We can basically speak of a unified North American market between the US and Canada, with the former being the single demand source for both.
Canada is a relevant producer of both sawn wood and wood panels (left-side charts), but it is not a relevant consumer (right-side charts).

Canada exports more than 60% of its production of sawn wood and wood panels (blue lines). The US, in contrast, is an importer market for both types of products (light blue lines), and doesn’t export a large part of its production (green lines).
 and wood-panels (right side) for the US and Canada from 2000 to 2024")
When we compare Canada’s export markets (graphs on the right side below) and the US import suppliers (graphs on the left side below), we find that accross all products, the US is almost the only market for Canadian products, with a small exception for sawn wood; whereas the US has a more diversified import supplier base, with more weight in Asia, LatAm.

The wood industry and construction after the GFC
As mentioned, most wood demand comes from construction, at least 66% directly (USFS, 2019). The enormous majority of its is single-family and repair and remodelling.

New construction
On the demand side, the most volatile cycle driver is housing starts. Housing activity shows a strong correlation with both the production level and the relative change in capacity utilization in the wood industry.
, all indexed to 100 in 2017")
We can observe how, after a period of high cyclicality between 1960 and 1990, housing climbed almost uninterrupted between the early 90s and 2006, along with wood demand. The GFC was a catastrophic collapse in housing starts, 75% fall from the peak in 2006 to the bottom in late 2009. Wood production halved in that period as well.
The post-GFC period was a slow recovery, similar to the 90s in its lack of cyclicality. This was interrupted by the pandemic and the current high-interest-rate period. We can observe how current levels of housing starts do not seem far out of line with the historical average in the US, but are still fairly depressed when compared to the late 1990s, early 2000s period. Wood consumption is also similar to that period.
Repair and remodelling
The second half of demand is repair and remodelling. Although new housing is twice as large as remodelling in dollar terms (first chart below), both consume about the same amount of wood materials. Both are correlated but more cyclical than real GDP (third chart below).
Remodelling did not fall as much after the GFC, and has continued growing after COVID, even as new construction stalled (second chart below). The reasons for this divergence between remodelling and new construction seem to be the lack of affordability for new buyers, homeowners preferring to stay in their houses to lock in lower interest rates, and a population that is growing more slowly.
, indexed to 100 in 1990 (second chart) and compared to GDP in real terms since 2008 (third chart)")
Other uses
Besides construction, other important uses of wood include:
Packaging and shipping, overwhelmingly pallets, is a large consumer of commodity lumber (~18/20 million m3). It is a relatively low-cyclicality sector that moves with real GDP.
Furniture, including cabinetry, consumes a mix of lumber and non-structural panels like MDF, about 3 million m3 each. Furniture is naturally a more discretionary category, but it is also secularly impacted by the US desindustrialization after the 2000s.
Out of the ‘other’ industries, the most important is utility poles, which is a standalone category of wood products.
 in wood containers and pallets, and household furniture and cabinetry")
Aggregate demand

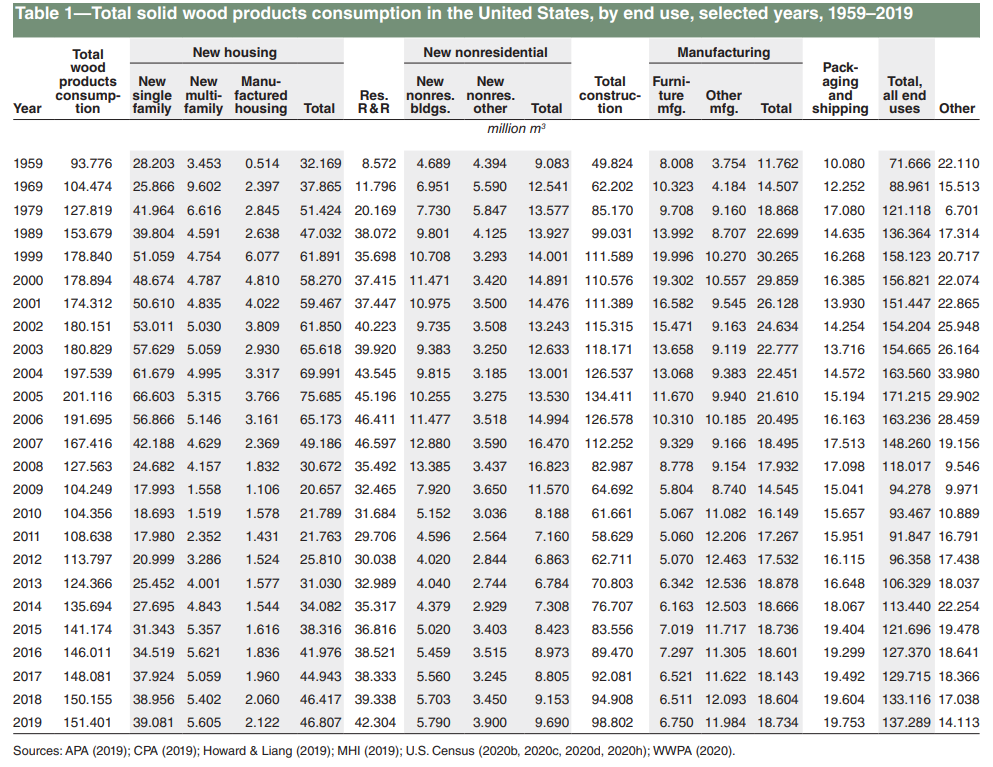
Adding all together, we definitely cannot talk of a growing wood industry in the US (and by extension, North America). Consumption levels are basically similar to those of the late 1980s, and the industry has not grown since 2015.
The industries that demand wood move along with real GDP, but there could be step changes caused by modifications in consumption or production patterns.
First, obviously, is new construction.
The wood market bulls will always mention an upcoming new build cycle as the stock of housing in the US ages and the ‘big wealth transition’ from boomers to millennials occurs. This could very well be, especially with the right credit and political conditions. A construction boom would be a secular tailwind for wood demand.
On the other hand, construction can also become a headwind if consumption patterns shift to smaller multi-family houses, a topic discussed in more detail in the Annex.
Without a boom or a change in consumption patterns, construction will still grow, albeit probably more slowly than GDP. The number of single-family units built is the same as in 1995, but their size and wood consumption per unit have increased 20%. Of course, this is not much when compared with 80% higher real GDP (in 2019), but we could still be suffering from the GFC lags.
In the case of remodelling, we have already observed that even though expenditure in remodelling is still strong, and grows above GDP over the long-term, it does not carry more consumption. Similar to new housing, although remodelling expenditures are up 130% in inflation-adjusted dollars since 1995, wood consumption is only up 20%. The total occupied housing stock seems to be more related to this driver.
Finally, we have manufacturing as a potentially small growth engine if either manufacturing is reshored within the US (for example, in the historical furniture states of the Southeast) or near-shored to Mexico, but still consuming mostly US South wood products. In both cases, however, I do not think that reindustrialization can be a huge driver, given the current size of manufacturing and other sectors in current consumption.
Capacity, utilization, and margins
The other side of the cyclical equation in wood is obviously supply, or rather, capacity.


During the 1990s and until the GFC, capacity expanded in line with an increasing construction industry and aggregate wood consumption. This kept capacity utilization at what can be considered fairly competitive and pressuring levels, only hovering above 80%, for most of that period.
The 1990s and early 2000s were a period of huge expansion in wood consumption, but capacity expanded in line with it. This tells us a lot about the long-term dynamics of the industry. It is hard to achieve capacity utilization even with a growing market.
The period after the GFC has been significantly more challenging. Capacity utilization quickly reached 50% during the GFC. Pain was probably significant because it triggered a large curtailment. In three years, the industry lost 25% of its capacity. By 2015, capacity utilization reached 70% again, and it is probable that more than half of that was curtailments, with the remaining being demand recovery.
Still, considering that capacity utilization has remained below 80% except for a small period around the pandemic, and that wood consumption fell 50% from the GFC and never recovered even half of that level (that is, even today it is 25% below of the GFC), the degree of curtailment is too low to recover profitability.
Even more, although during most of the 2010s, capacity additions were fairly constrained in aggregate, a small period of higher profitability in the mid-2010s quickly led to a new wave of capacity additions.
Finally, when utilization improved above 80% during the post-pandemic demand boom, and as we will see below, and wood producers enjoyed record margins, capacity additions appeared again very quickly.
From an industrial perspective, this is not a good sign. The curtailment was slow, small in relative terms, and utilization (and consequently margins) has been permanently impaired since. As soon as margins improved, capacity was added fast and aggressively.
Historical margins
We can get an idea of margin compression/expansion during the 2000-2020 period by comparing producer price indexes in the US for logs (solid blue line below) with the producer price indexes for processed wood products like lumber, plywood, or reconstituted wood (dotted lines).
The 1990s were not marked by margin expansion. If anything, by pressure. Log prices climbed at the beginning of the period, and downstream products grew only moderately more. Again, low aggregate utilization and capacity additions accompany the expanding demand.

The inter-recession period of the early 2000s had a huge margin expansion, coincident with the peak of the housing bubble. If we go back to the capacity chart at the start of this section, we see how it rapidly led to capacity expansion.

The 2010s see a recovery in margins, as capacity utilization consistently improves. Again, the sprouts of better margins in 2014/15 led to capacity additions quickly. The 2017/2019 is probably the outlier here. It coincides with the start of the collapse of the Canadian BC wood industry.

After COVID, the combination of stimulus policies led to exploding margins. The profits in this period are absolutely record-breaking, and will be hard to repeat in the future, given that they were the combination of immense demand with relatively tight supply.
The exorbitant profits led to a new wave of capacity additions, which, combined with lower construction activity because of higher rates, led to a new low in utilization and depressed margins yet again.

The last chart above does not fully capture the margin situation of wood producers today. With the exception of the GFC, capacity utilization in the US wood products industry has never been as low as it is currently, and producers are feeling it, with most of them not making adjusted EBITDA profits in sawmilling in 2024 or 2025.
