15-page dive into the heart of the Chemicals industry
∙ Paid
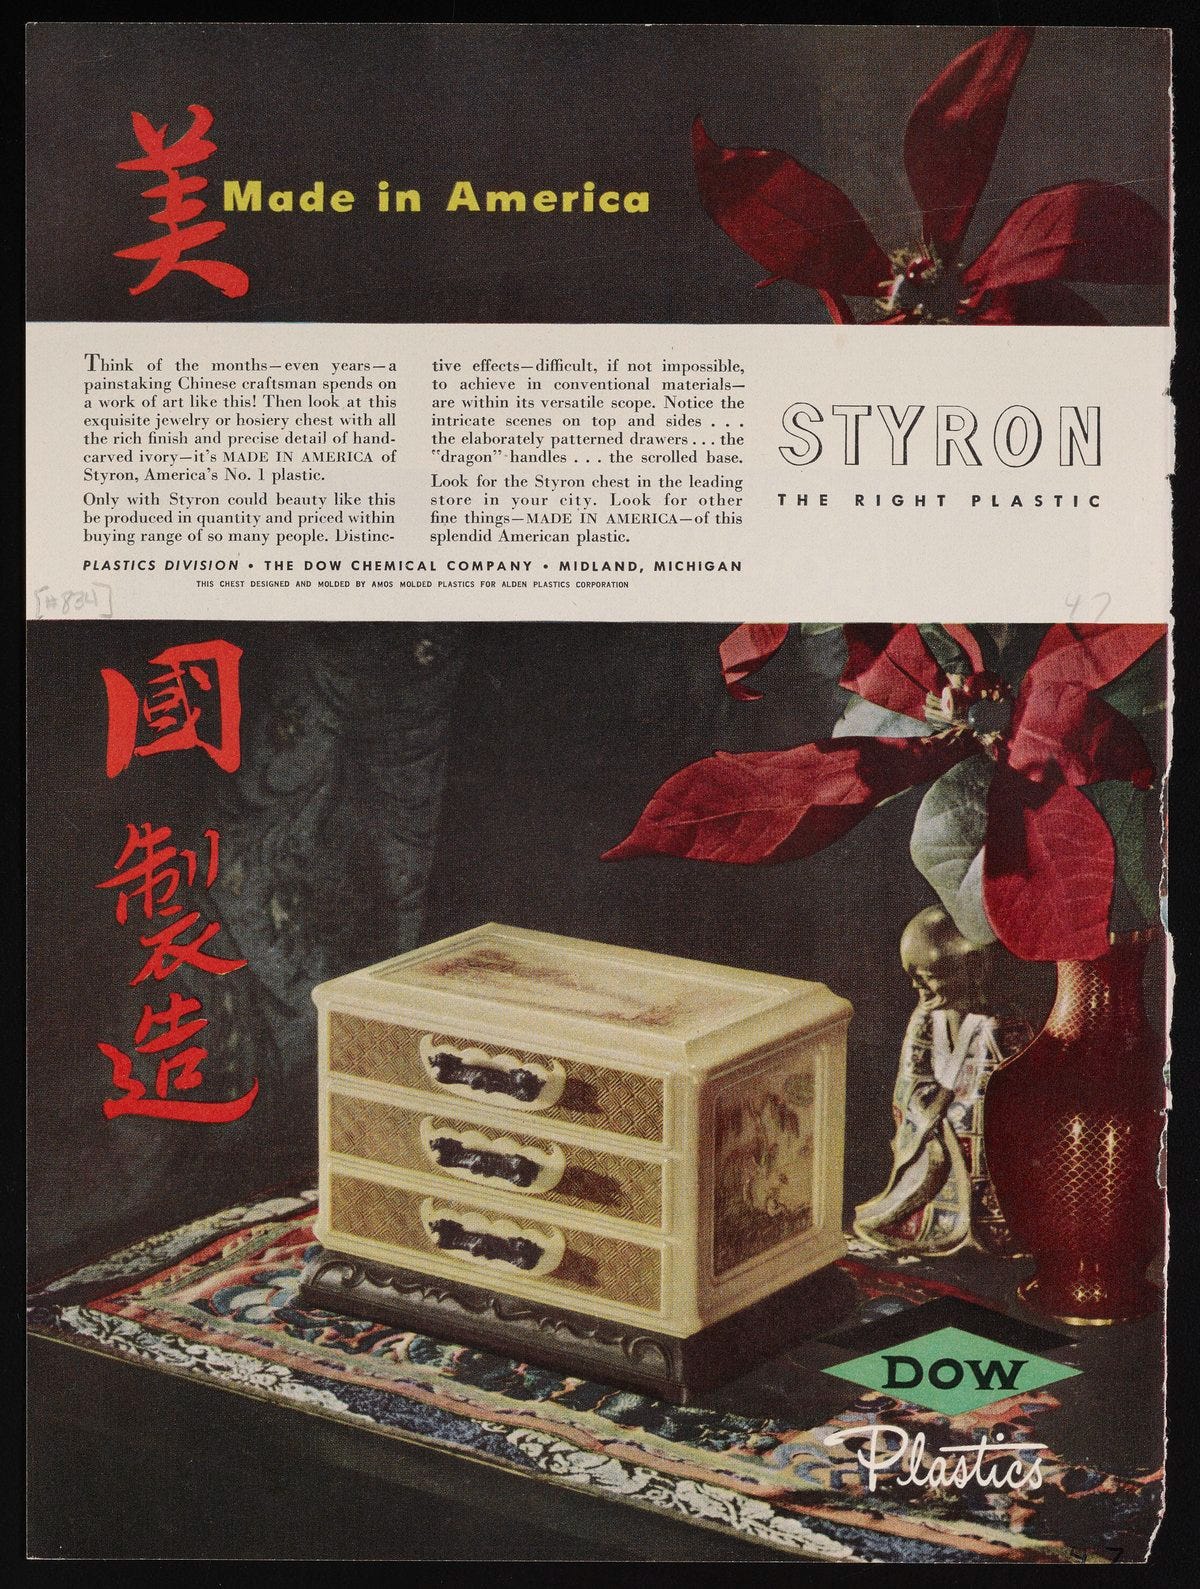
Made in America (in Chinese in red), depicting a Chinese box made of ABS plastic (commercial name Styron) - Dow Chemicals Advertising - 1947 - Science History Institute
The Chemical industry is underg…
Continue reading this post for free, courtesy of Quipus Capital.