Sentiment changes from glut to shortage, does it have any battery left?
∙ Paid
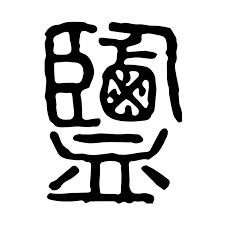
An archaic version of the Chinese character for salt 盐 was composed of the ideograms for container, brine, worker, and government official. Salts and brines were a big thing in antiquity, at the core…
Continue reading this post for free, courtesy of Quipus Capital.